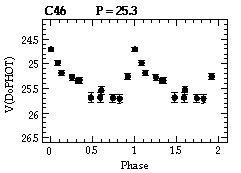
From Ferrarese et al. (1996)

From Ferrarese et al. (1996)
Cepheid periods range from a few days to approximately 100 days. If you knew in advance that a particular star was a Cepheid, you could acquire a good light curve fairly easily. By measuring the brightness of the Cepheid every hour or so over the course of a few periods, you would have a fabulous record of the variability of the Cepheid. In reality, images of whole fields of stars are taken at random times, often weeks apart. Computer programs are needed to identify individual stars on the images and search for periodic behavior.
The astronomers first use sophisticated programs to identify starlike objects on their images. The images are digital, and can readily be manipulated and analyzed by computer programs. The position and brightness of each star is stored in a database. Once stars have been identified and cross-correlated on separate images, more computer programs are used to look for periodic variations. The computer program picks a period, then tests to see whether the brightness variations agree with that period. If not, it tries an incrementally larger period. The program runs through the full range of known Cepheid periods. It either outputs the best period for the data, or decides that the brightness variations are not periodic.
If the brightness variations are periodic, all the data are time shifted to mimic the scenario in which the observations were made in one period. This is called ``phasing'' the data, and provides the most information about subtleties in brightness variations. Cepheid variables are identified by a characteristic shape to their light curves; phasing the data helps the eye discern that characteristic shape. (Note the lopsided shape to the light curve above.) A phase difference of 1 corresponds to one full period. In the light curve above, the phase range from 1 to 2 is an identical copy of phase 0 to 1 (look at the light curve and verify this last point). Two phases are shown to aid the eye in distinguishing the shape of the light curve.