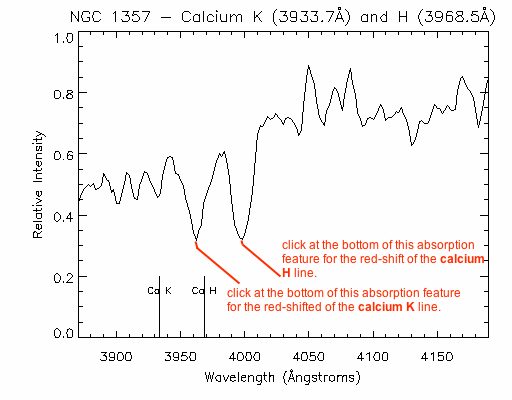
The absorption lines due to ionized calcium will be among the strongest ("deepest") of all the lines. It's a good initial step with any of the spectra to find these two lines. The black lines at the bottom of the figure (Ca K and Ca H) show the location of the rest wavelengths. These rest wavelengths are also spelled out at the top of the figure.
As you can easily see, the measured wavelengths are going to show a sizeable shift toward redder (longer) wavelengths. On the working spectra, you will be clicking at the bottom of each of these strong wavelengths.
For this galaxy, the measured wavelength of the Ca K line was 3962.0 Ångstroms (carry at least 5 significant digits); and for the Ca H, 3997.2 Ångstroms. The differences between measured and rest wavelengths are 28.3 Ångstroms (3962.0 - 3933.7) and 28.7 Ångstroms (3997.2 - 3968.5). The redshifts are 28.3/3933.7 = 0.0071, and 28.7/3968.5 = 0.0072.

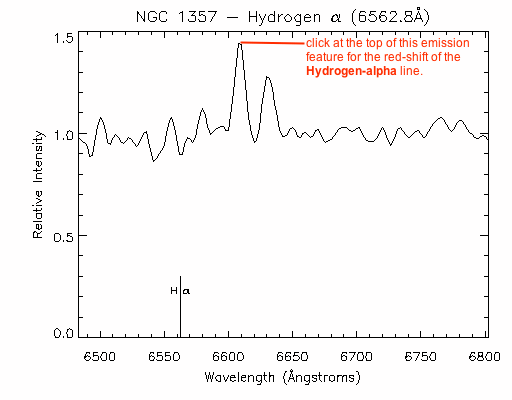
As you can see in this figure, there are two strong emission lines that are greater than 30 Ångstroms away from the rest wavelength of hydrogen-alpha, shown by the black vertical line at the bottom. Pick the strong emission line that is to the left (blueward, or at shorter wavelengths) of the other strong emission line, even if the other one has more intensity. (The strong emission line on the right is due to ionized nitrogen.)
The measured wavelength was 6608.6 Ångstroms, giving a shift of 45.8 Ångstroms (6608.6 - 6562.8). The redshift is 45.8/6562.8 = 0.0070.
You should recognize that although the wavelength shift was greater, the redshift (z) is nearly exactly the same. (As it should be if we are measuring the correct line; after all, it's the same galaxy!)