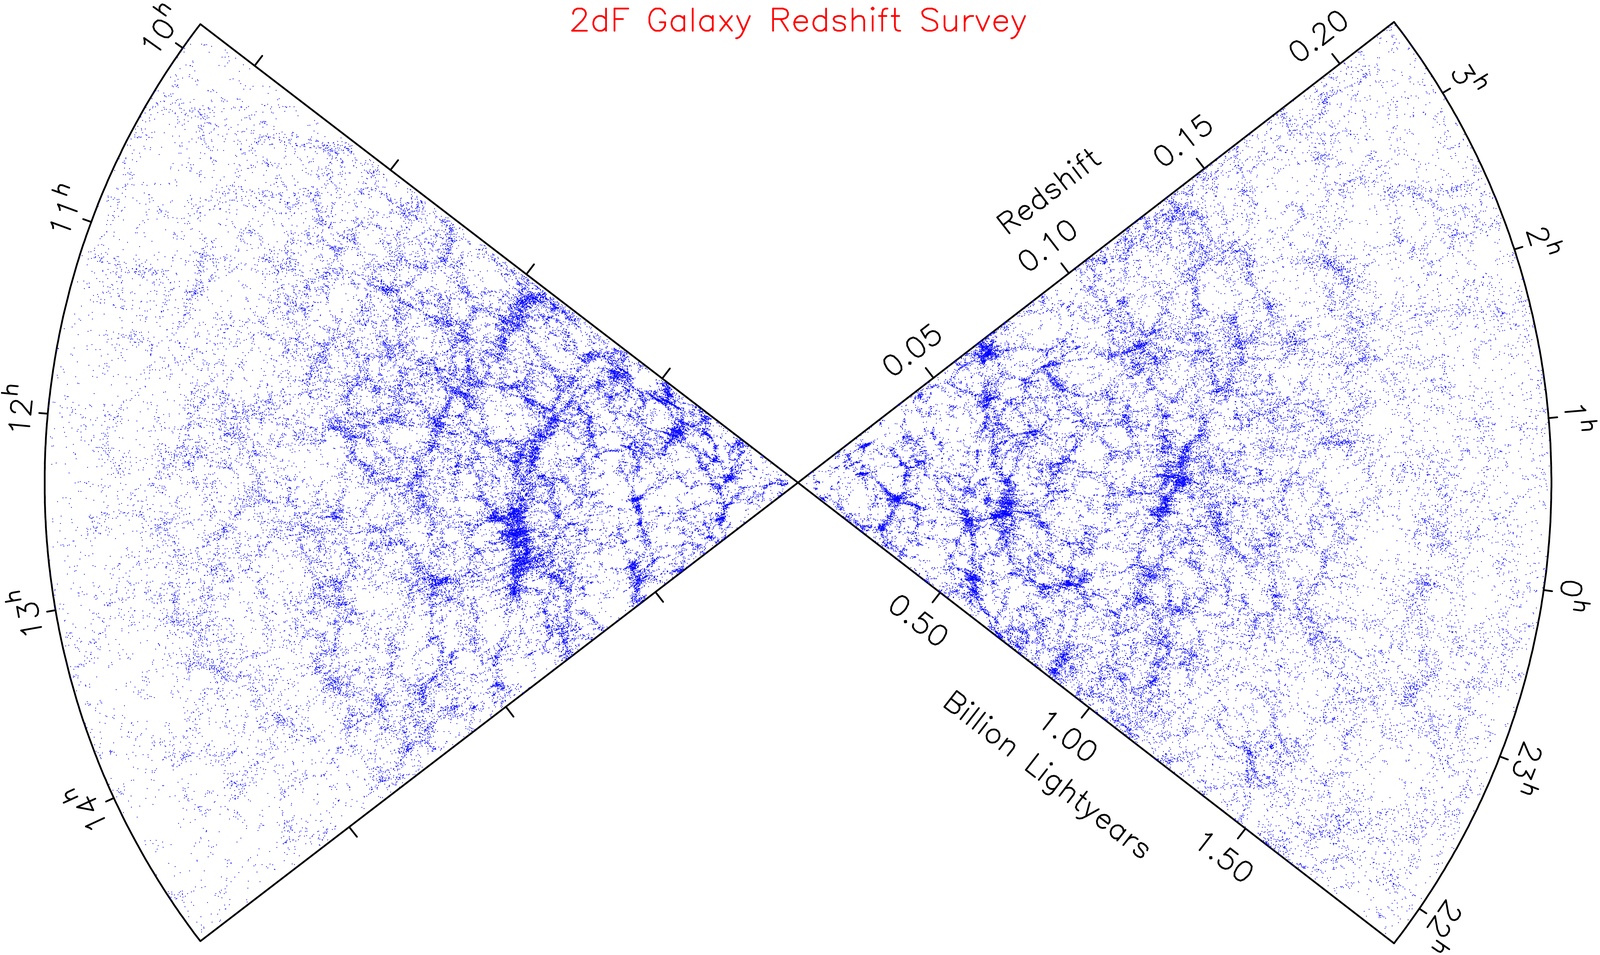
A plot of sky coordinates vs. distance for galaxies in the Two-Degree Field (2dF) Galaxy Redshift Survey.
Credit: 2dF
We can investigate the clustering of galaxies in two ways, as the galaxies appear projected on the plane of the celestial sphere and according to the distances at which we believe them to lie. Astronomers obtain spectra of the galaxies in an image to determine their redshift velocites and then use Hubble's distance-redshift relation to determine the distances. In this way, we have not only mapped out the distances to millions of galaxies.
The plot below is a representation of the Two-Degree Field (2dF) redshift data for the redshift distances to over 220,000 galaxies.
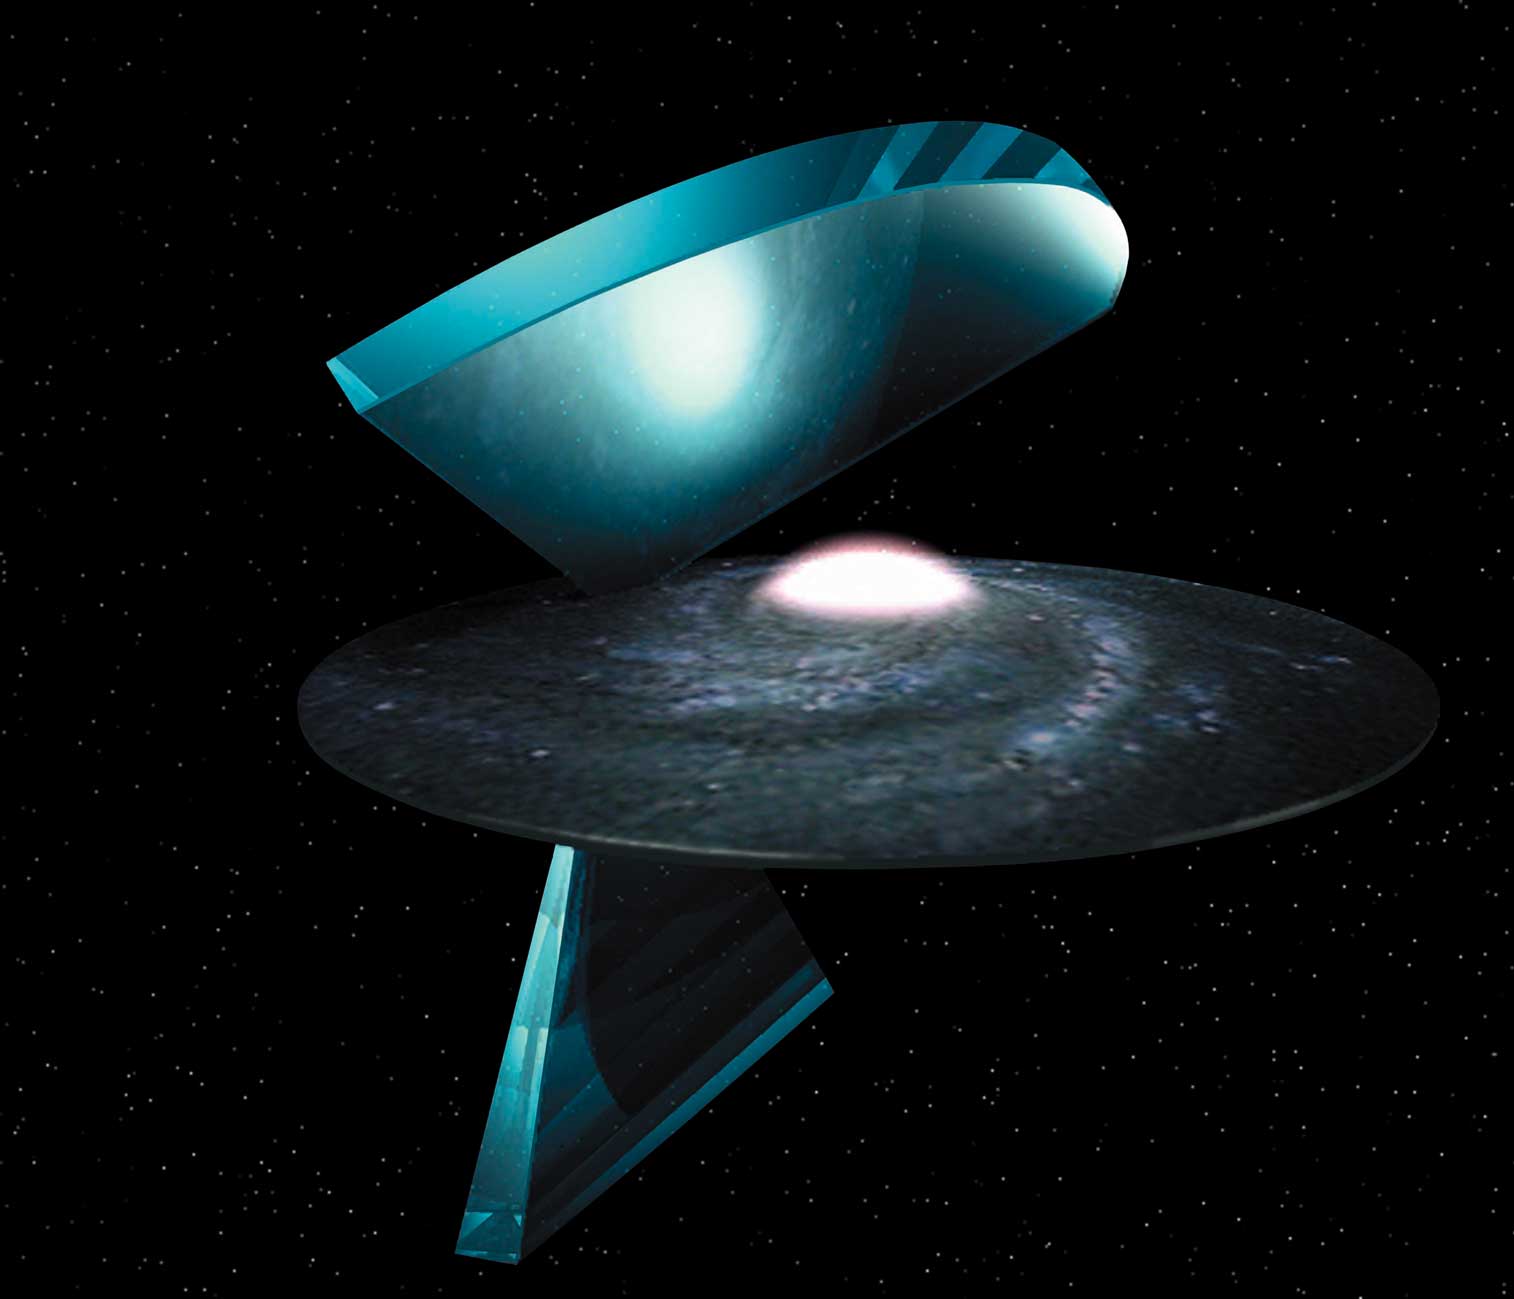
To interpret this plot, picture it as a slice of the sky as seen from Earth. So Earth is at the center of the image. Each point on the plot is a galaxy. The direction to that point indicates its location on the sky, and the distance from the center of the image indicates its distance from Earth.
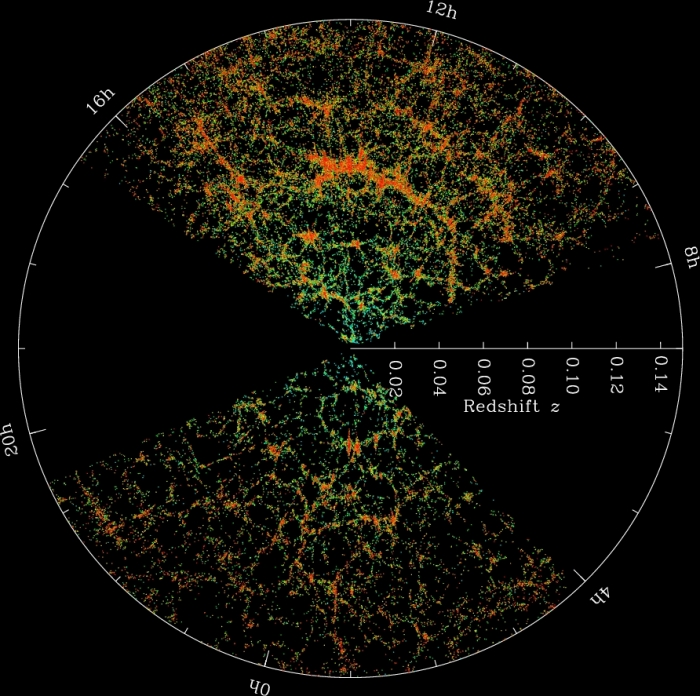
A comparable figure for Sloan Digital Sky Survey (SDSS) data shows the same type of large scale structure in a different direction on the celestial sphere.
© 2009 Richard Gelderman